
|
|
|
The following examples demonstrate potential uses for Mapyrus. All examples require a series of commands to define data, and the appearance of the data in the image file that is created.
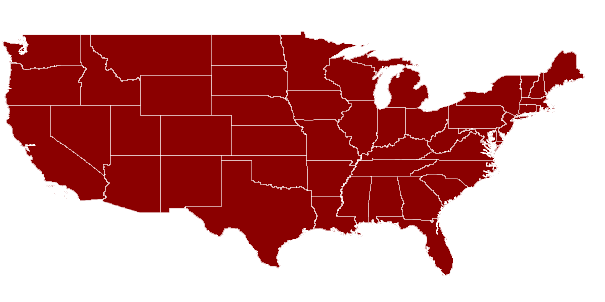
The simplest example is reading and displaying polygons from an ESRI Shape file.

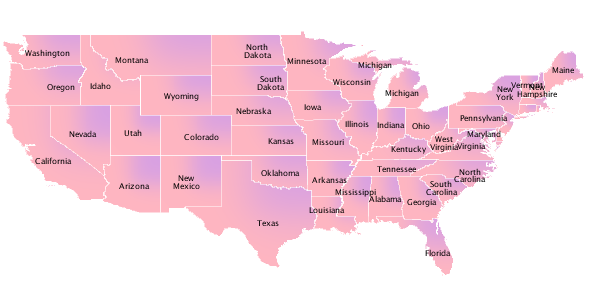
After adding more commands, labels are displayed too.
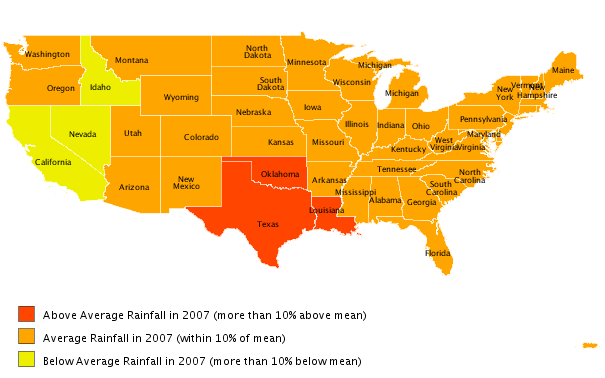
Using attribute information from the ESRI Shape file and if-then-else tests enables states to be displayed in different colors, depending on attribute values.
By changing the output format type, the same example can be created as an SVG file or a PDF file.
Another way attributes can be used is to display a pie-chart in each polygon.

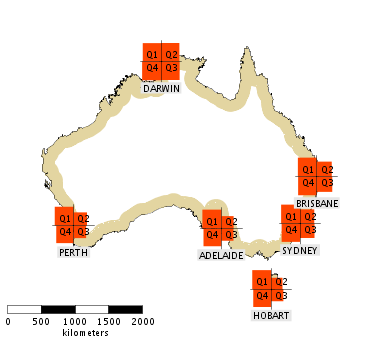
Attribute data can also be used to construct other types of charts such as quadrant charts.
By using Mapyrus to generate an HTML imagemap it is possible to link to different web pages depending on where the mouse is clicked on the map and also to call Javascript functions as the mouse is moved over the map (in this case Javascript functions are called on onMouseOver events to change the web page text).
|
|
Move mouse over a state
|
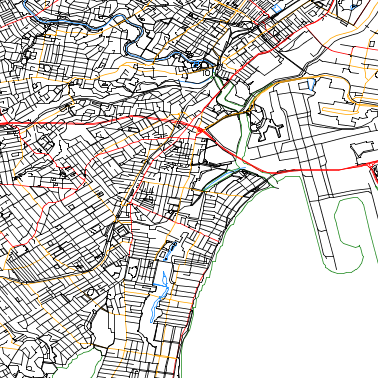
Mapyrus also displays data stored in OpenStreetMap format. A simple example displays different categories of data in different colors.
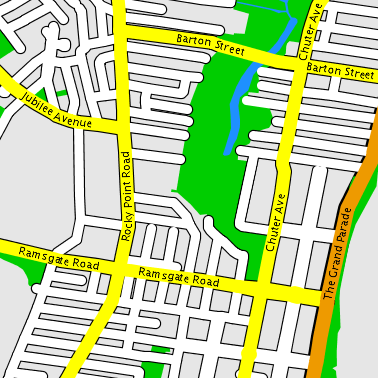
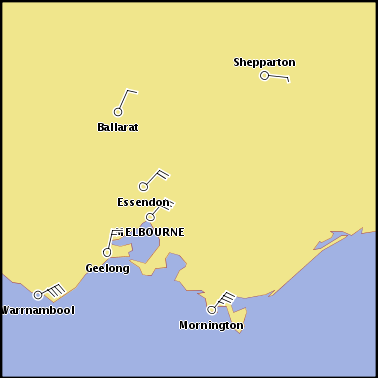
By displaying the data two times and using different colors and line widths for different categories of roads, and adding street labels, the result is an appearance similar to a street atlas.
It is also possible to use Java Topology Suite functions with Mapyrus to perform geometric tests and display and/or report the results. The next example demonstrates this, finding streets within 400m of a given point and reporting the street names, and displaying them on a map in a different color.

|
|
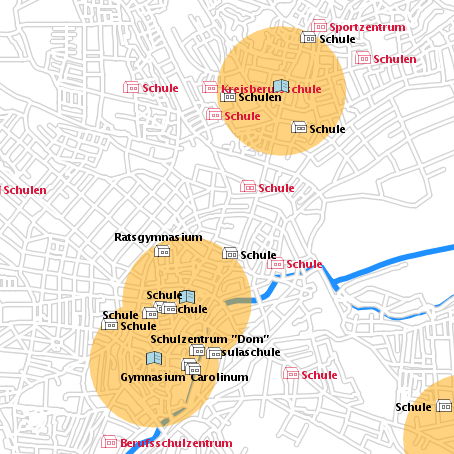
The same approach works for individual locations. In the next example, a buffer is calculated around some points and then other data is colored differently depending on whether it falls inside the buffer.
|
Legend: 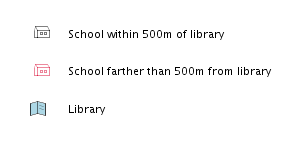

|
The following example demonstrates generating a convex hull and a buffer around a set of points to show habitat area for a particular type of animal.
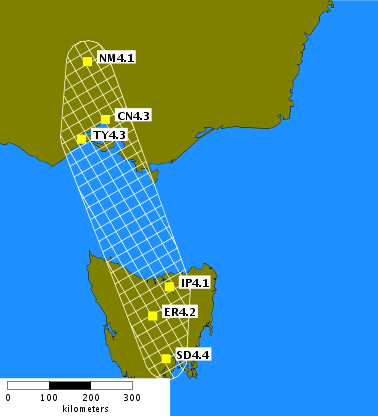
The next example shows the direction and strength of the wind graphically at a number of sites. The bearing and strength values at each site control how each wind indicator is displayed.
|
Legend:


|
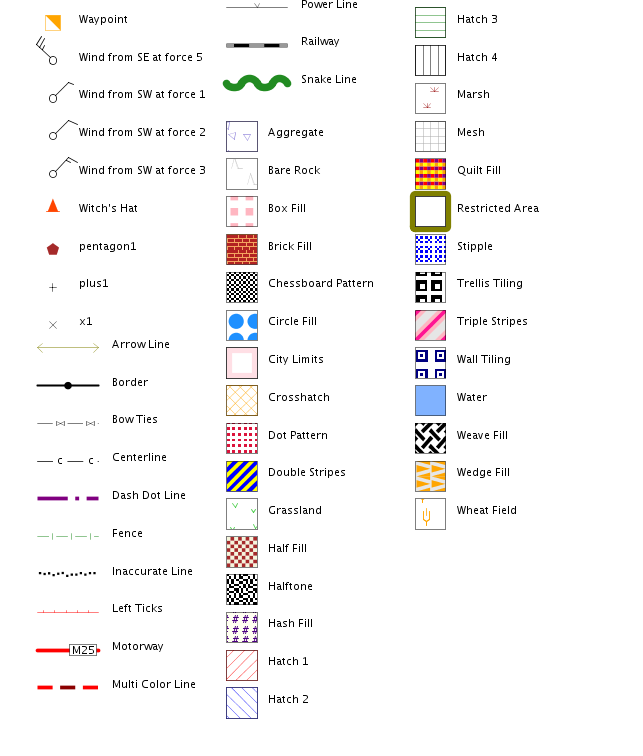
A mixed bag of sample symbols, line patterns and fill patterns is included in Mapyrus. Following is a legend showing what is available.

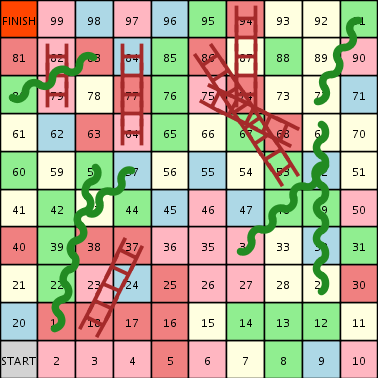
The final example demonstrates that Mapyrus is able to perform less serious tasks such as automatically generating random boards layouts for snakes and ladders games, and a pattern for a six-sided dice for playing the game.


Updated 21 August 2016